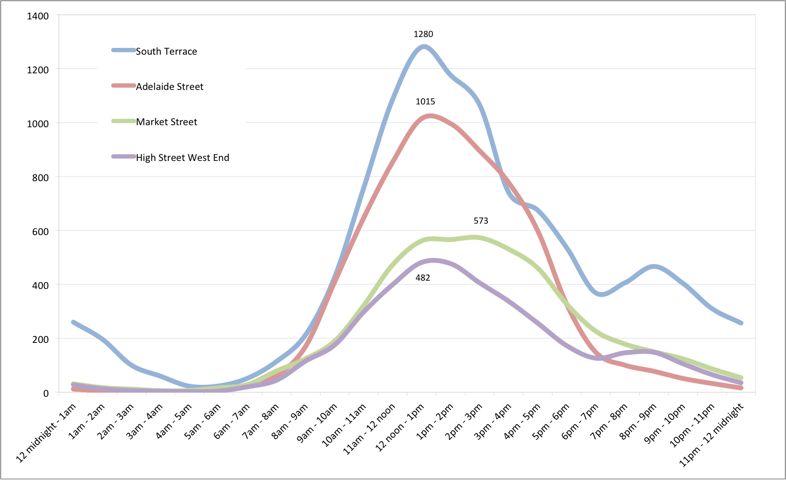
An analysis of hourly footfall trends in January 2014 across Fremantle’s four counters.
It shows different volumes (line heights) and hourly changes throughout the day (the shape of the lumps).
Each line represents a different counter. The blue one is the biggest and busiest – South Terrace (averages about 345,000 people per month, so far).
* * *
Below shows us the average daily footfall for for the last four months, for each counter.
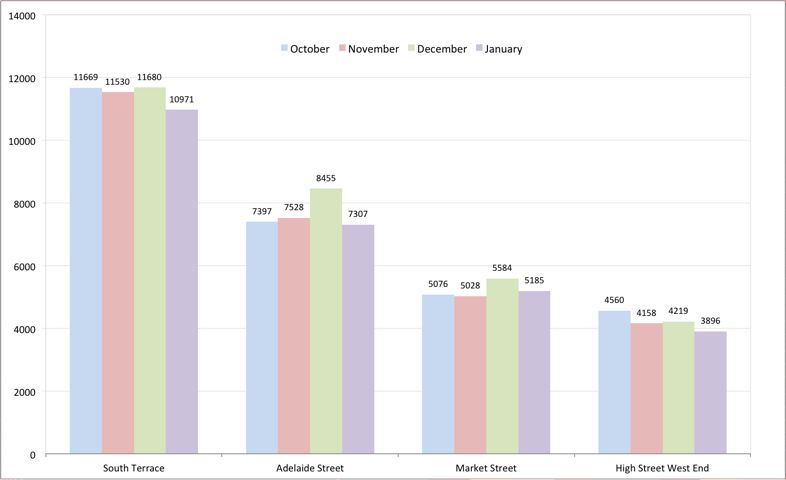
Remember: The counters count 24/7, 365.
South Terrace had a moody January. Why? January: people away for holidays. South Terrace is more a leisure-area.
High Street West End is University Street. Notre Dame students affect the footfall at this location. The variations after October are affected by university holidays.
Market Street and Adelaide Street have the most reliable January. Market Street is used by Train Station customers, and Adelaide Street is in the middle of the banking and bustop areas.
Adelaide Street had the most impressive response to December.
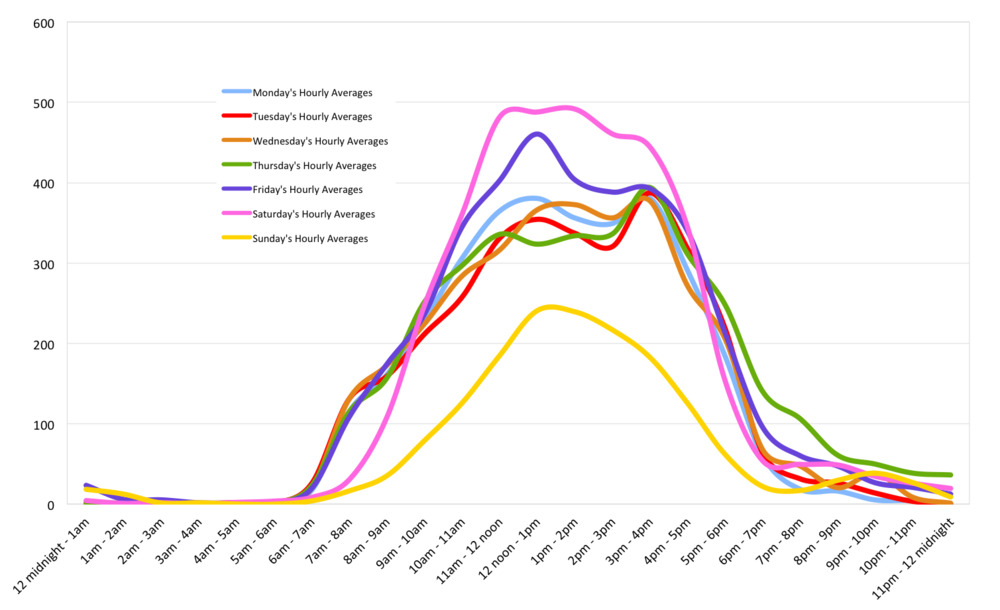
The daily footfall in Adelaide Street is remarkably favourable to the retailer’s clock – it rises and falls with the opening hours of general retail. See below:
Average hourly footfall in Adelaide Street Fremantle as seen across the seven days of the week
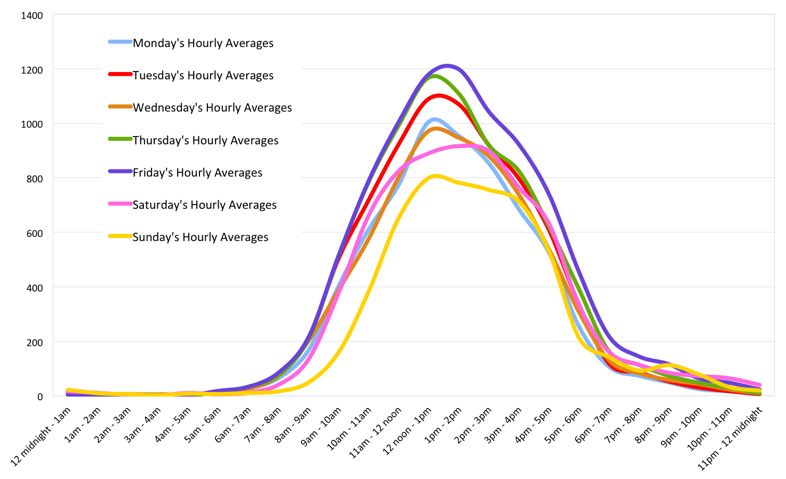
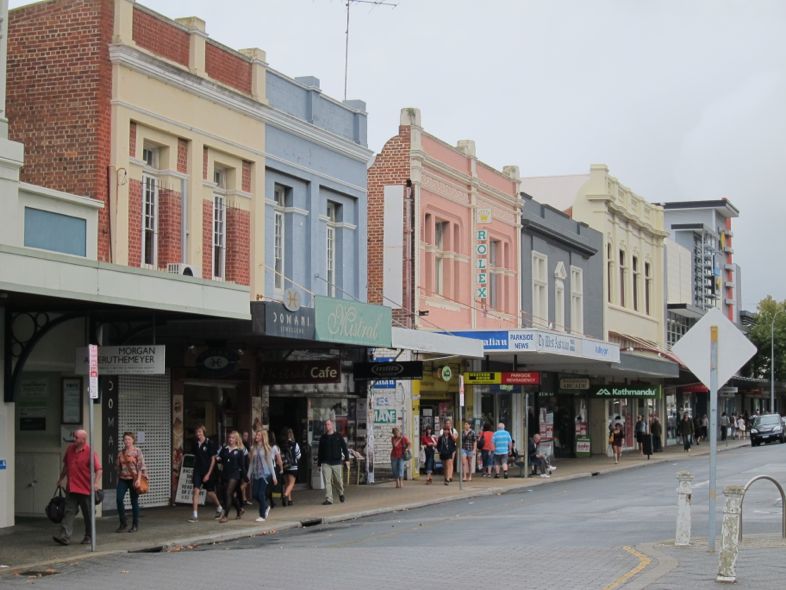
To see what I mean, look at this one, in East Victoria Park’s mainstreet.
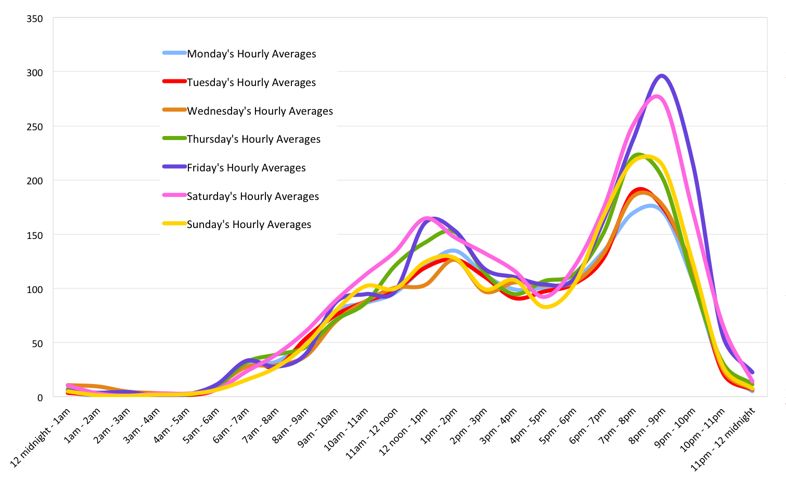
This is Adelaide Street.
Thank you.